
Image
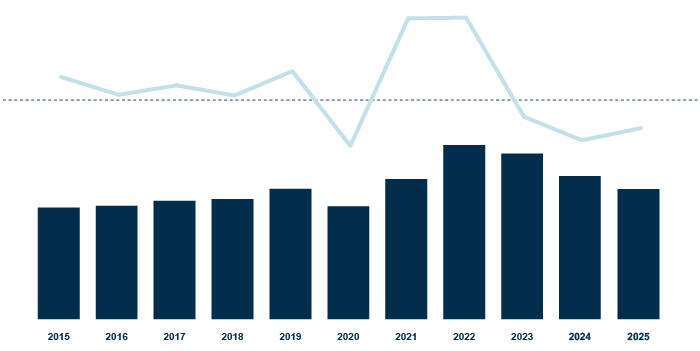
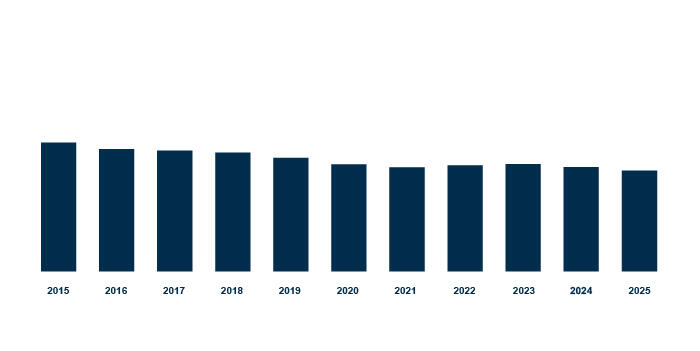
| FY2015 | FY2016 | FY2017 | FY2018 | FY2019 | FY2020 | FY2021 | FY2022 | FY2023 | FY2024 | FY2025 | |
|---|---|---|---|---|---|---|---|---|---|---|---|
| Net revenues (€/000) |
1,362,012 | 1,383,848 | 1,444,907 | 1,464,533 | 1,590,735 | 1,376,767 | 1,709,572 | 2,126,127 | 2,021,128 | 1,748,351 | 1,592,808 |
| yoy growth | +6.9% | +1.6% | +4.4% | +1.4% | +8.6 | -13.5% | +24.2% | +24.4% | -4.9% | -13.1% | -8.9% |
Image
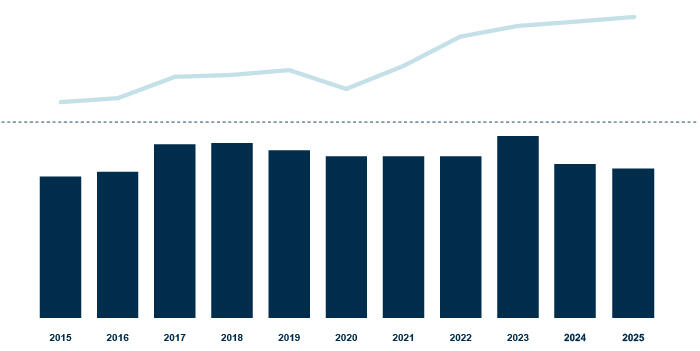
| FY2015 | FY2016 | FY2017 | FY2018 | FY2019 | FY2020 | FY2021 | FY2022 | FY2023 | FY2024 | FY2025 | |
|---|---|---|---|---|---|---|---|---|---|---|---|
| Operating earnings before depreciation and amortisation (EBITDA) (€/000) |
160,777 | 168,469 | 209,622 | 213,309 | 222,649 | 186,235 | 230,512 | 287,298 | 307,825 | 271,077 | 252,856 |
| EBITDA margin | 11.8% | 12.2% | 14.5% | 14.6% | 14% | 13.5% | 13.5% | 13.5% | 15.2% | 15.5% | 15.9% |
Image
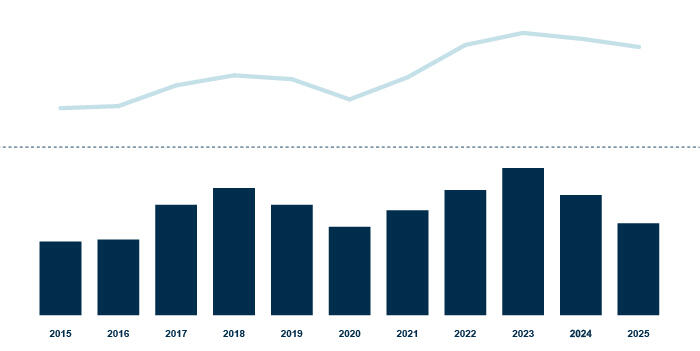
| FY2015 | FY2016 | FY2017 | FY2018 | FY2019 | FY2020 | FY2021 | FY2022 | FY2023 | FY2024 | FY2025 | |
|---|---|---|---|---|---|---|---|---|---|---|---|
| Operating earnings (EBIT) (€/000) |
54,054 | 57,008 | 86,433 | 100,601 | 95,256 | 66,445 | 97,750 | 143,679 | 160,847 | 129,289 | 99,910 |
| EBIT margin | 4.0% | 4.1% | 6.0% | 6.9% | 6% | 4.8% | 5.7% | 6.8% | 8.0% | 7.4% | 6.3% |
Image
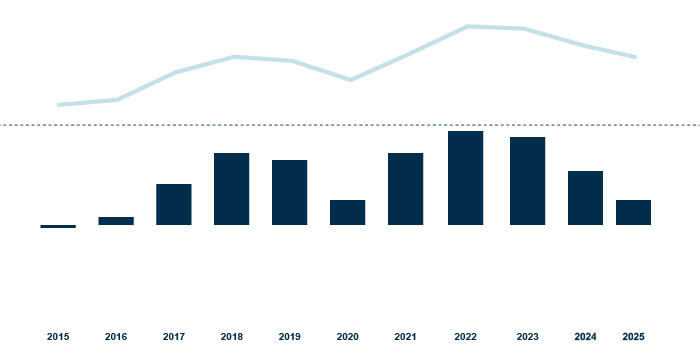
| FY2015 | FY2016 | FY2017 | FY2018 | FY2019 | FY2020 | FY2021 | FY2022 | FY2023 | FY2024 | FY2025 | |
|---|---|---|---|---|---|---|---|---|---|---|---|
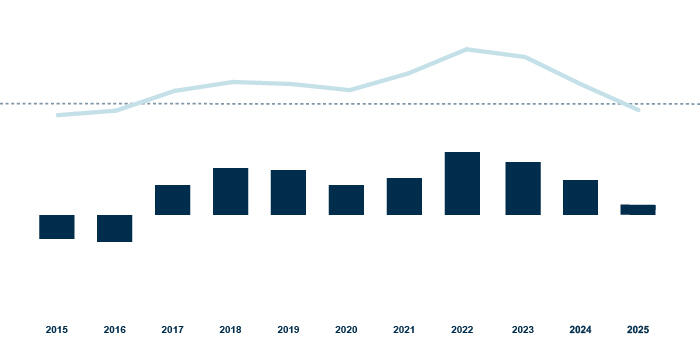
| Earnings before taxation | -1,809 | 4,496 | 39,016 | 58,558 | 53,446 | 29,404 | 62,180 | 96,849 | 90,883 | 52,455 | 26,737 |
| Before taxation margin | -0.1% | 0.3% | 2.7% | 4.0% | 3.4% | 2.1% | 3.6% | 4.6% | 4.5% | 3.0% | 1.7% |
Image
| FY2015 | FY2016 | FY2017 | FY2018 | FY2019 | FY2020 | FY2021 | FY2022 | FY2023 | FY2024 | FY2025 | |
|---|---|---|---|---|---|---|---|---|---|---|---|
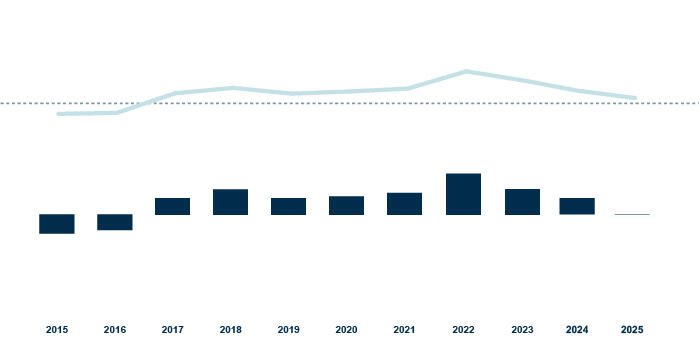
| Net margin (including non-controlling interest) | -13,672 | -8,345 | 14,884 | 25,412 | 22,974 | 15,806 | 35,424 | 63,898 | 54,874 | 29,583 | 10,745 |
| Net margin (gross of non-controlling interest) | -1.0% | -0.6% | 1.0% | 1.7% | 1.4% | 1.1% | 2.1% | 3.0% | 2.7% | 1.7% | 0.7% |
Image
| FY2015 | FY2016 | FY2017 | FY2018 | FY2019 | FY2020 | FY2021 | FY2022 | FY2023 | FY2024 | FY2025 | |
|---|---|---|---|---|---|---|---|---|---|---|---|
| Group earnings for the period (consolidable) (€/000) |
-9,554 | -8,663 | 8,189 | 12,863 | 7,889 | 9,754 | 12,267 | 27,087 | 19,082 | 6,038 | 98 |
| Net margin (net of non controlling interest) | -0.7% | -0.6% | 0.6% | 0.9% | 0.5% | 0.7% | 0.7% | 1.3% | 0.9% | 0.3% | 0.0% |
Image
| FY2015 | FY2016 | FY2017 | FY2018 | FY2019 | FY2020 | FY2021 | FY2022 | FY2023 | FY2024 | FY2025 | |
|---|---|---|---|---|---|---|---|---|---|---|---|
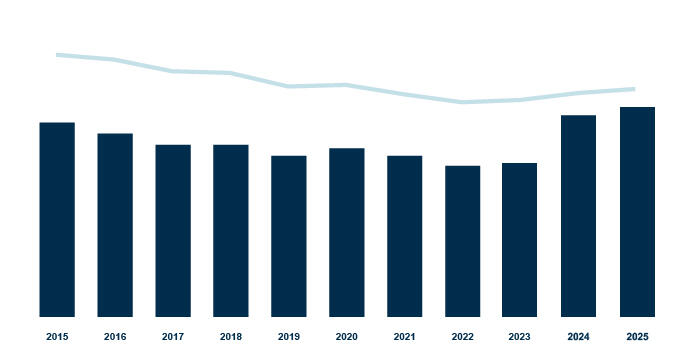
| Net financial position (€/000) |
(926,652) | (906,852) | (858,920) | (852,029) | (796,396) | (802,904) | (764,233) | (731,695) | (827,363) | (947,253) | (986,598) |
| NFP/EBITDA | 5.8 x | 5.4 x | 4.1 x | 4.0 x | 3.6 x | 4.3 x | 3.3 x | 2.5x | 2.7x | 3.5x | 3.9%x |
Image
| FY2015 | FY2016 | FY2017 | FY2018 | FY2019 | FY2020 | FY2021 | FY2022 | FY2023 | FY2024 | FY2025 | |
|---|---|---|---|---|---|---|---|---|---|---|---|
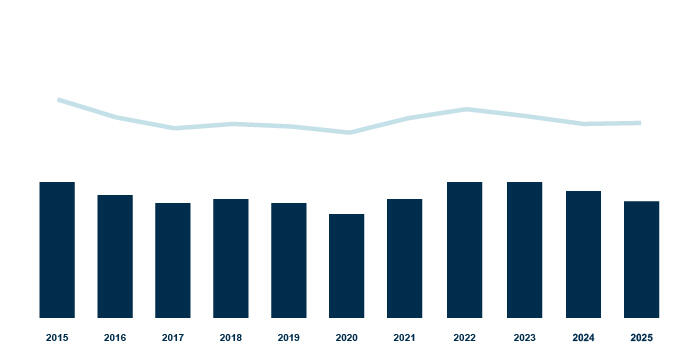
| Consolidated shareholders' equity (€/000) |
428,094 | 392,558 | 370,689 | 379,375 | 374,313 | 361,949 | 390,867 | 408,856 | 395,267 | 385,403 | 350,547 |
| Shareholders' equity / Net financial position | 0.5 x | 0.4 x | 0.4 x | 0.4 x | 0.5 x | 0.5 x | 0.5 x | 0.6 x | 0.5x | 0.4x | 0.4x |
Image
| FY2015 | FY2016 | FY2017 | FY2018 | FY2019 | FY2020 | FY2021 | FY2022 | FY2023 | FY2024 | FY2025 | |
|---|---|---|---|---|---|---|---|---|---|---|---|
| Personnel (number) | 7,424 | 7,054 | 6,964 | 6,851 | 6,552 | 6,167 | 5,997 | 6,109 | 6,188 | 5,992 | 5,799 |
