
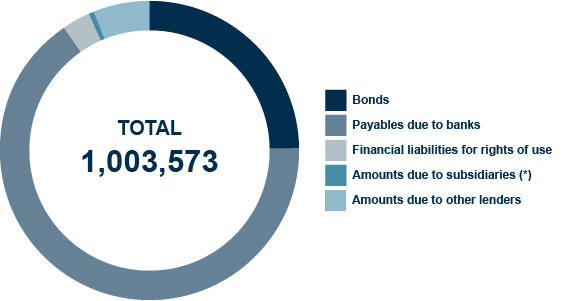
The graph below show the level of debt repayments to 31 December 2022 the Group.
Image
| In thousands Euros | Nominal value at 31/12/2022 | Portions falling due within 12 months | Portions falling due within 31/12/2024 | Portions falling due within 31/12/2025 | Portions falling due within 31/12/2026 | Portions falling due within 31/12/2027 | Portions falling due Beyond |
|---|---|---|---|---|---|---|---|
| Bonds | 250,000 | 0 | 0 | 250.000 | 0 | 0 | 0 |
| Payables due to banks | 663.788 | 329.499 | 100.791 | 52.947 | 96.776 | 38.308 | 45.467 |
| Financial liabilities for rights of use | 30.531 | 11.611 | 6.356 | 4.887 | 2.533 | 1.168 | 3.976 |
| Amounts due to subsidiaries (*) | 6 | 6 | 0 | 0 | 0 | 0 | 0 |
| Amounts due to other lenders | 59.248 | 59.072 | 71 | 71 | 34 | 0 | 0 |
| TOTAL | 1.003.573 | 400.188 | 107.218 | 307.905 | 99.343 | 39.476 | 49.443 |
(*) not consolidated on a global integration basis
